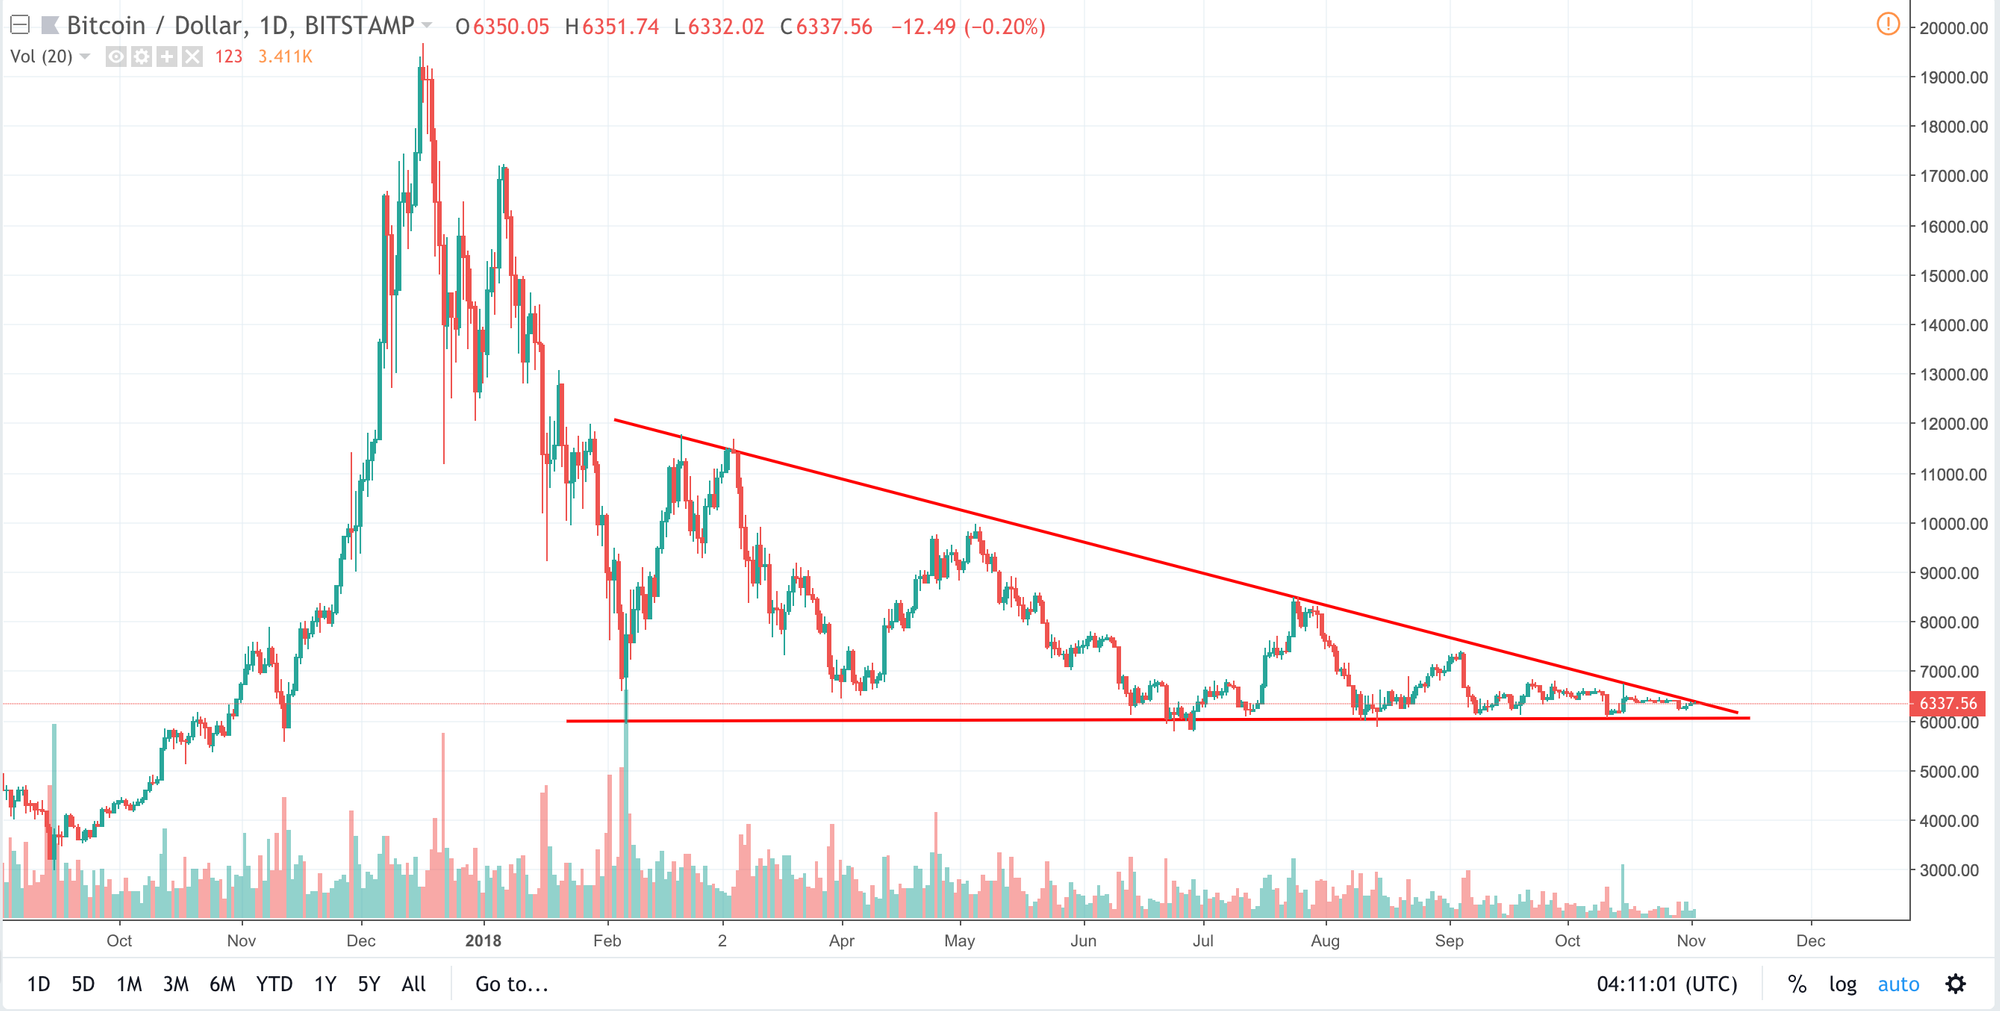
A lot of people see a descending triangle pattern for the bitcoin price in USD as a bearish signal, but I'm bullish in a longer term. Let me first explain what's the 'Descending Triangle'
DEFINITION of 'Descending Triangle'
A descending triangle is a bearish chart pattern used in technical analysis that is created by drawing one trendline that connects a series of lower highs and a second horizontal trendline that connects a series of lows. Often times, traders watch for a move below the lower support trendline because it suggests that the downward momentum is building and a breakdown is imminent. Once the breakdown occurs, traders enter into short positions and aggressively help push the price of the asset even lower.
source https://www.investopedia.com/terms/d/descendingtriangle.asp
I agree that's a common descending triangle is a bearing signal in a shorter term. But in I believe it would quickly reverse and turn bullish in the long term.
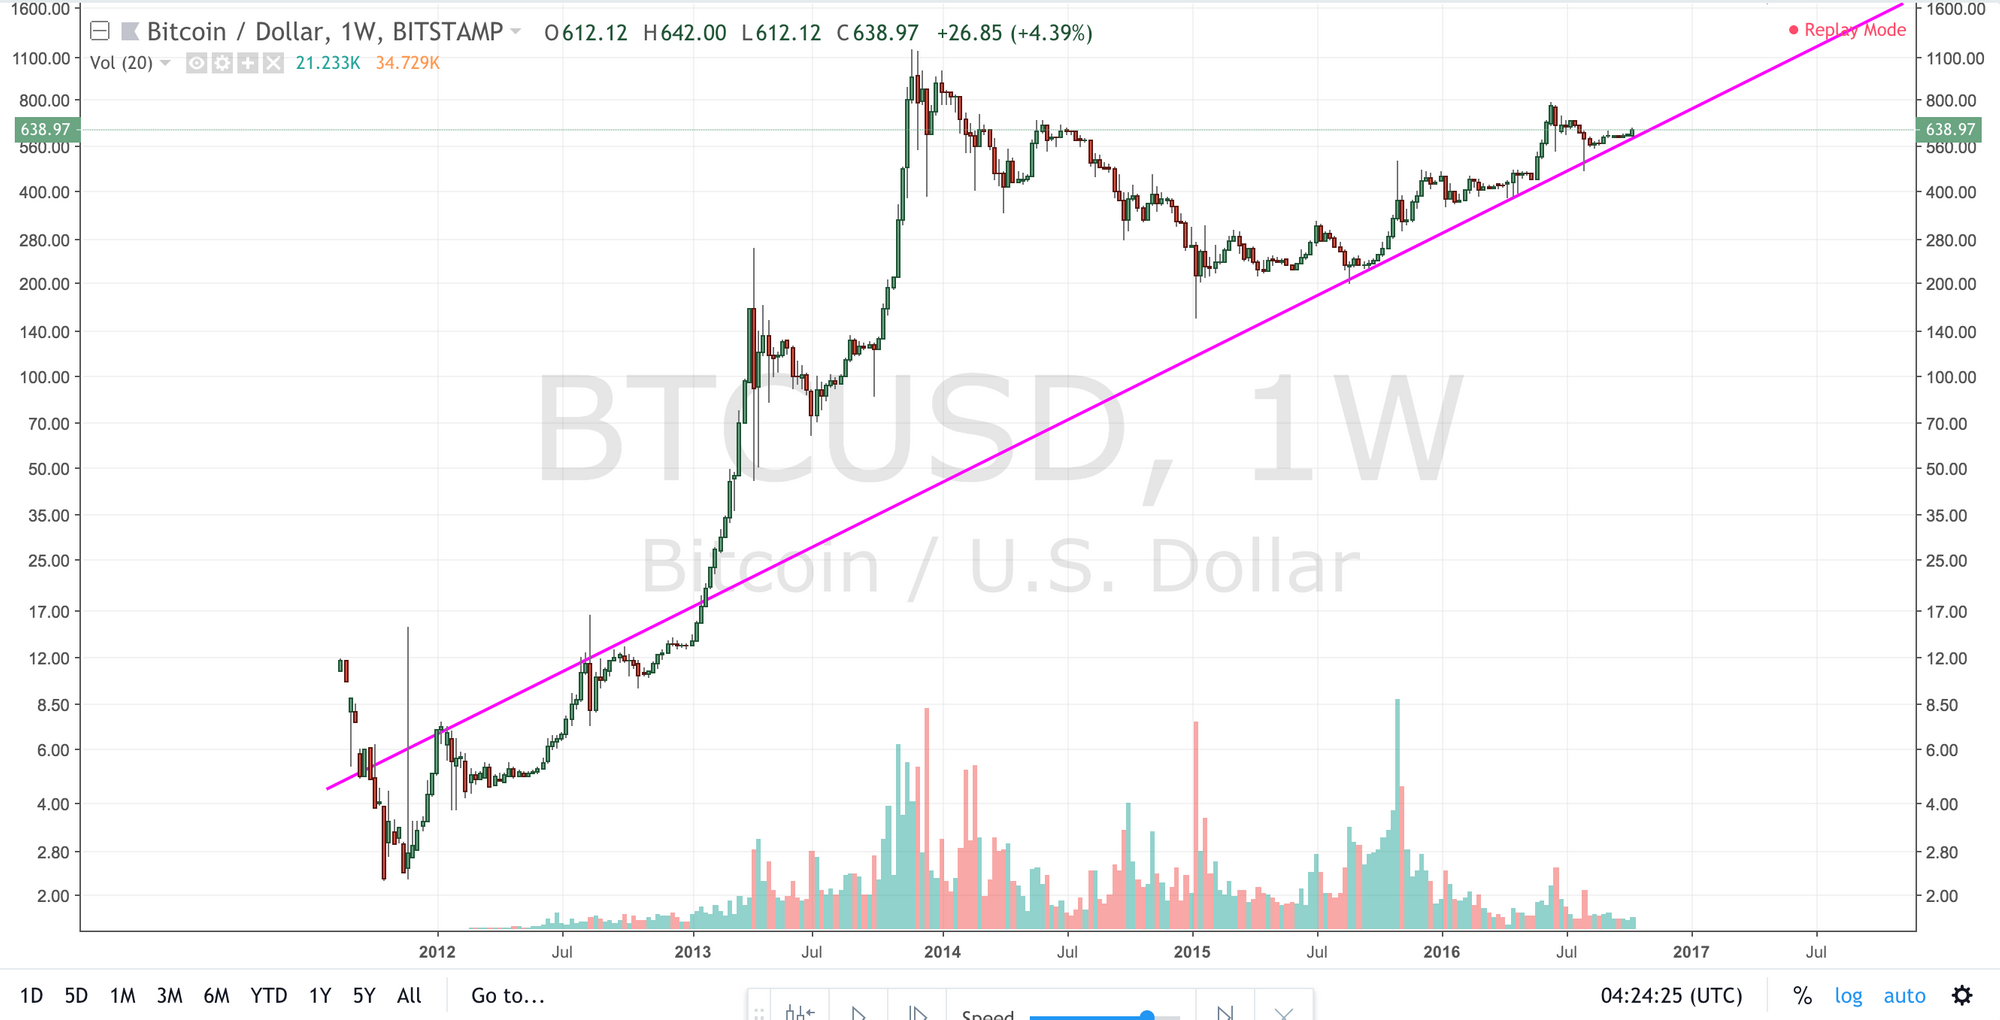
I've started tracking bitcoin price since the April of 2016. The price started to recover after the end of 2013 bubble burst. Eventually, I found a very interesting support line in logarithm price of BTC. It's when we use a log scale on Y-axis, or simply Y = log(X) where X is the price.
The support line starts almost from the moment BTC was listed on the first exchange. I use data from Bitstamp since it has even more data than Coinbase.
Let's compare the situation now vs post-bubble of 2013:
- It's used worldwide for certain international payments.
- Bitcoin futures are traded on CBOE, so large institutional investors are participating.
- Fidelity announced their support for cryptocurrency trading.
- 401(k) can be invested in bitcoin using ETFs like GBTC.
- The hashrate and the difficulty of bitcoin network keep growing.
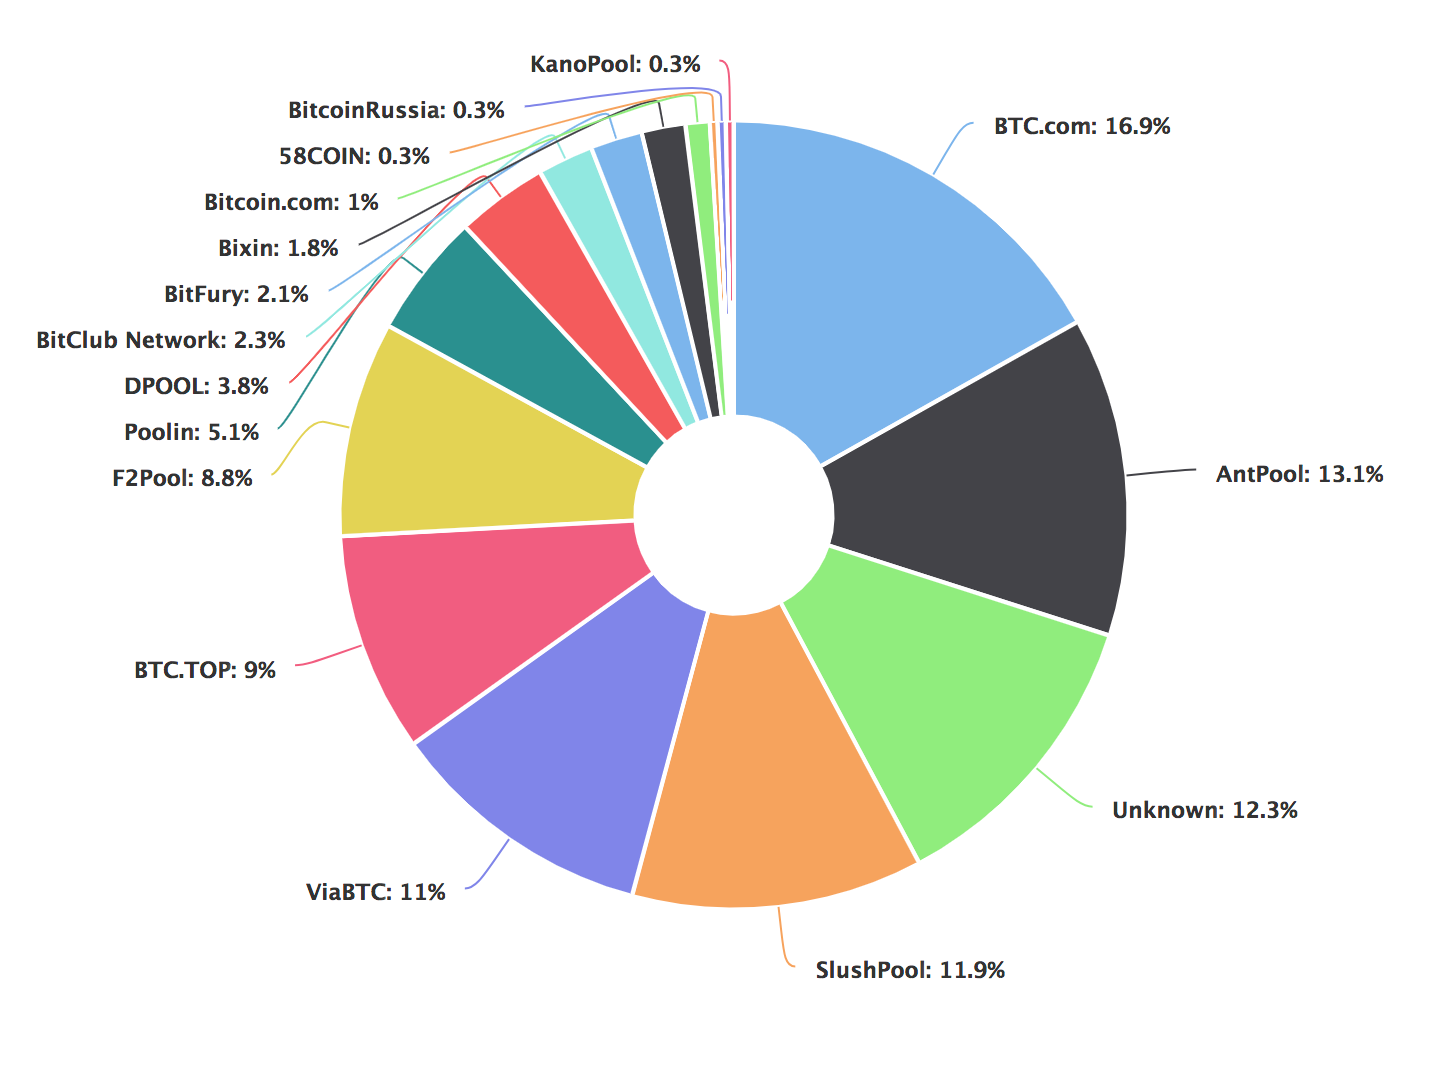
- The decentralization and security of the network are good as well since no 3 mining pool combined control more than 50%.
- Of course, there is a ton of altcoins and shitcoins (not counting all already failed ICOs). But bitcoin is dominating the total cryptocurrency market cap by being more than 50% of the total.
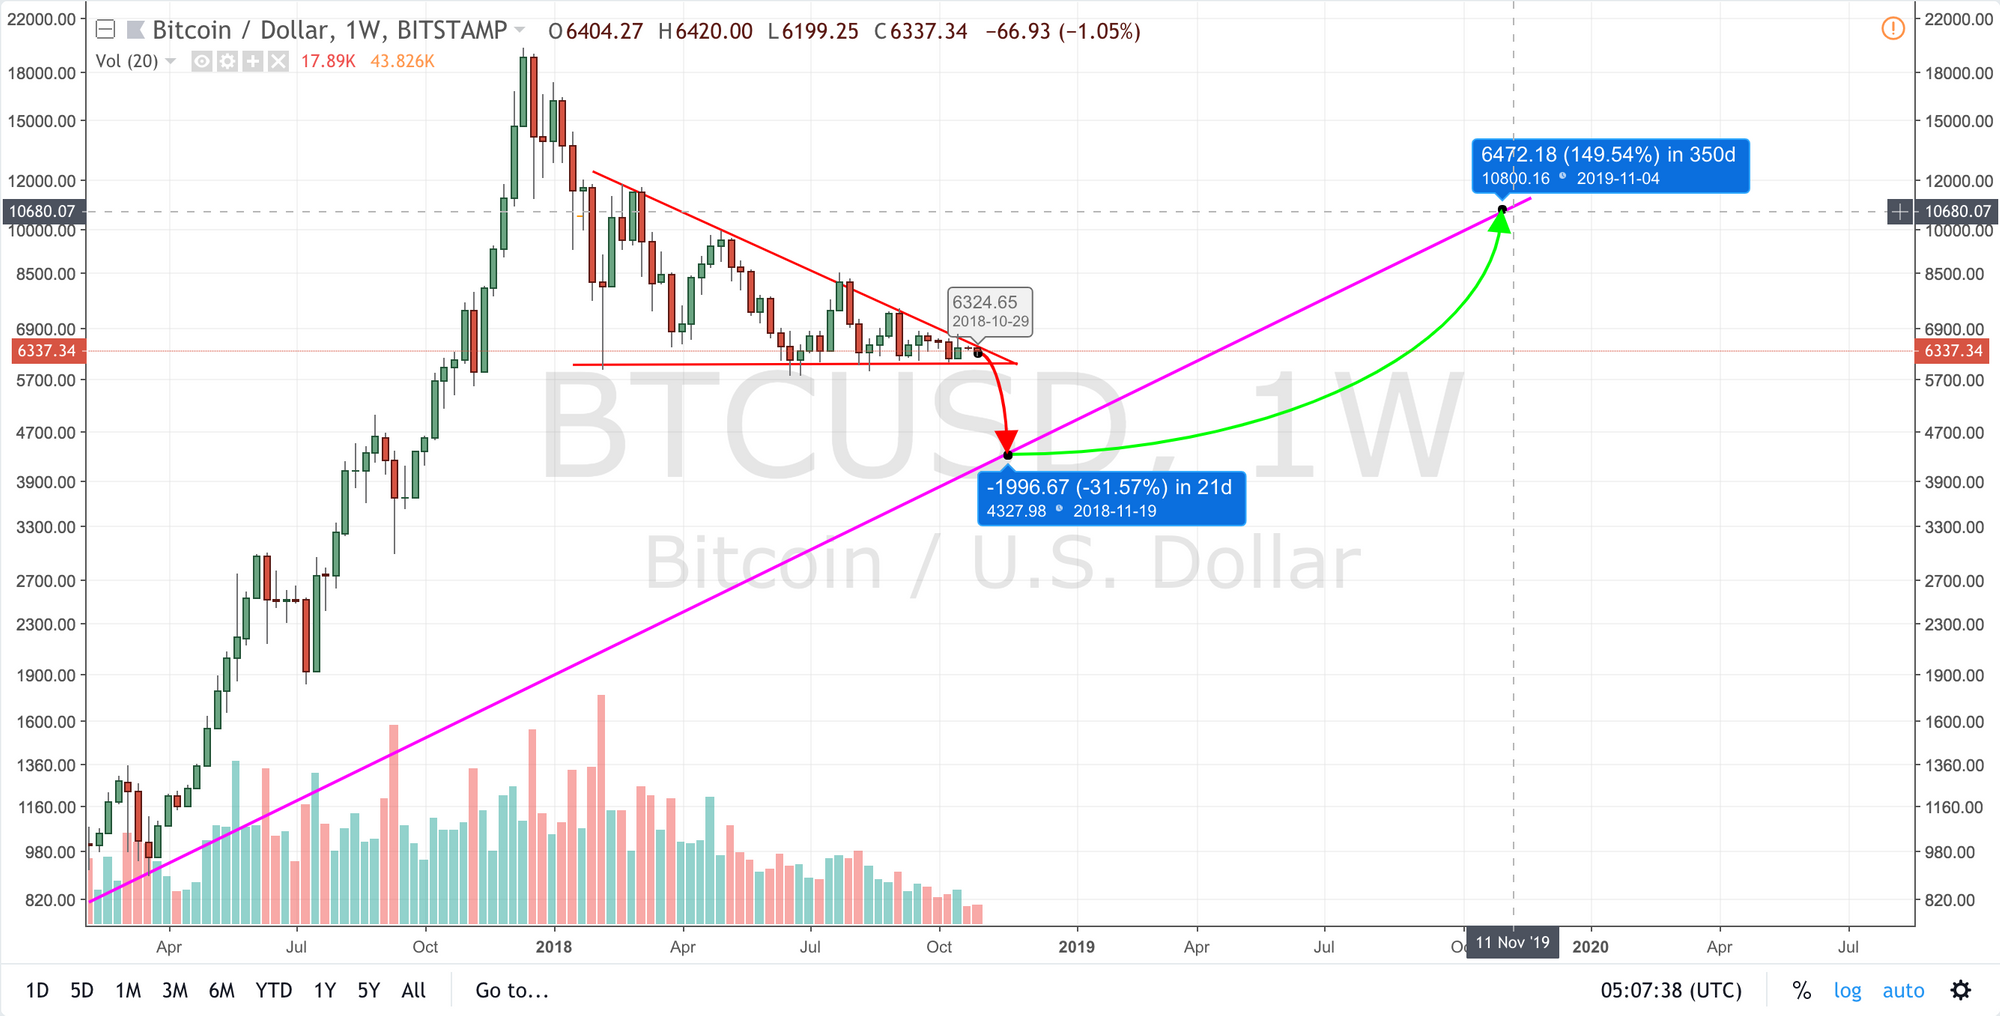
So coming back to technical analysis, let's combine the long-term support line with the descending triangle. While writing this post, I've redrawn all of my lines and reworked the analysis. Once I properly adjusted the support line to best fit the data from Sep 2015 (post-bubble recovery) to March 2017 (new bubble start), I found some mistakes in my previous charts.
There still a room for price to fall toward the log support line, but in the long-term, the outlook is very bullish.
I'm long some bitcoin now and would add more on the dip.
As a final note, make sure you don't confuse BTC core with shitcoins forks like BCH (bitcoin cash) or BTG (bitcoin gold).
Charts screenshots are done using tradingview.com. They are doing fantastic work with their browser native HTML5 implementation. Huge thanks to them.
Whether you like the analysis or have any feedback, please leave a comment below.
Never invest more than you are willing to lose.
The information provided by this post and accompanying material is for informational purposes only. It should not be considered legal or financial advice. You should consult with an attorney or other professional to determine what may be best for your individual needs.